
Where did all the money go?

Photo by Jessica Kranski on Unsplash
A couple of weeks ago we looked at the take-down of cash in emerging markets - a lot of that cash isn’t coming back into use, thanks to the efforts of regional tech (and fintech) giants.
One of the additional conclusions we made was that with all of this growth situated squarely in the private markets, public market investors would likely find that being short the banking incumbents that are unable to adapt is probably the best risk-adjusted approach to the theme of Finance 2.0.
Was there nothing we could buy? We couldn’t be sure. We knew who would lose out, but it wasn’t so clear who would emerge the winner.
Turns out the private markets, commonly believed to be free of the “noise” of public trading and focused on “real fundamentals” instead of “just stock market momentum”, aren’t as straightforward as we’ve been told to believe.
Let’s talk about liquidity
The lack of liquidity in private markets is a well known fact. That is an issue that deserves an in-depth discussion, but for now let’s discuss liquidity in the broader sense. This time we’re actually looking for the money - not just the cash.
For the past 10+ years, something strange has been going on. The aftermath of the 2008-09 crisis saw some pretty drastic measures being taken to try and bring the economy back to the straight and narrow. After years of reckless lending, the US property market imploded in a chain reaction of subprime defaults, which took down some of the biggest banks in the world at the time, most notably Lehman Brothers.
Films were made and books were written but it seems like the lessons that were meant to be learnt were taken only at face value. Because this happened:

Source: Bloomberg
The coordinated response to the fallout was to ease monetary policy, all the way to the zero lower bound and when the policy rate couldn’t fall any further, central banks started expanding money supply and taking assets on to their balance sheet in order to encourage risk-taking in the markets.
The rationale was simple: make the safest assets (government bonds) so uninteresting to invest in that capital that’s dished out flows to corporates, leading to improved investment and spending, effectively stimulating the economy out of its malaise.
The rest, as they say, is history - not in a good way. We continue to deal with the ramifications of zero (or in the case of Japan and most recently Germany, negative) interest rates, particularly in terms of the distortion of economic incentives, particularly for risk taking.
If you think the world has more or less come to the conclusion that zero/negative rates are a bad idea and has moved on, think again. The IMF even recently is still pondering how to Make Negative Rates Work.
Hint: it has to do with electronic money. And no, it doesn’t necessarily make things better for everyone.
Ben at Epsilon Theory has articulated this change in the market zeitgeist perfectly in his note “This Is Water” - a must-read, in our view.
Our question, however, alludes to something much more sinister in nature: Where did all that money that was created go?
Accounting for just under US$20tn of central bank liquidity is by no means an easy task, and it didn’t seem wise to undertake a forensic accounting exercise on every bank in the world. But we did have a hunch as to where an outsized re-allocation of capital might have happened.
Private markets.
What goes up must come down
Coincidental with the post GFC “recovery” was a material shift in the market’s perception of private equity and venture capital. What was previously an enigmatic, secluded corner of finance, restricted to the mahogany panelled offices of the likes of Blackstone and KKR (of “Barbarians at the gate” fame), became the new destination for all the cool kids of finance.
Hedge funds were out, Private Equity was in. No surprise that this also perfectly coincided with the meteoric rise of the tech startup in the popular imagination, whether one subscribed to the “enigmatic founder” image of Steve Jobs or the “move fast and break things” San Francisco school of thought.
Turtlenecks and hoodies became a thing - although we subsequently learnt that not everyone in a black turtleneck holds credibility. All around the world, and especially so in the US and Asia, the world was enraptured (and perhaps partially blinded) by the renewed promise of the “start-up”. With hindsight, the numbers explain it all.

Source: Preqin, Pitchbook, Bain
At the same time that central bank balance sheets were expanding, this esoteric asset class - private equity and venture capital combined - was lifted along with the tide, more so than any other asset class. Again, this is logical in hindsight: if the aim of the central banks’ accommodative policy was to urge more capital into risk assets, then the most under-allocated (i.e. the most risky and illiquid) would - as a percentage of a smaller base - enjoy the largest growth potential.
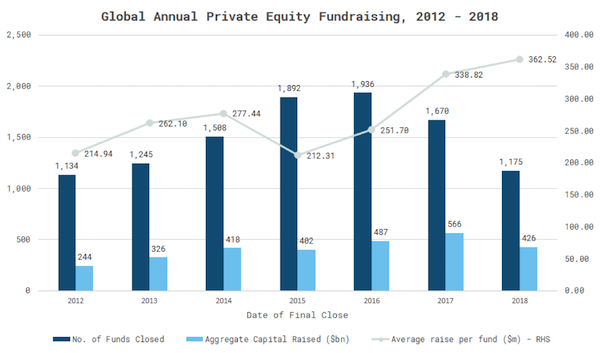
And grow it did. Based on data from Preqin dating from 2012 - 2018, the industry hit peak private equity mania in 2016, with a whopping 1,936 private equity funds closing their funding rounds that year, raising a total of US$487bn in funds. 2017 saw an even larger total raise but with fewer funds, leading to an even larger average size per fund as the capital floated to the bigger players in the market.
As a result, in 2018, even though the absolute number of funds and total capital raised started to tail off globally, the average assets raised per fund is at an all time high of US$362m.
In fact, the same can be said of ALL private markets. While the public markets were being ruthlessly distorted by QE in all its forms, accelerated by ETFs and central bank buying (to the extent of the Bank of Japan actually owning a segment of Japanese Equities - 77.5% of Japan’s ETF market at last count (Reuters)), the flipside of the distortion was an outsized allocation into private capital. From real estate to infrastructure to natural resources to PE/VC - the cash was flowing, and flowing fast.

To give a better perspective of the extent of the mania in the PE/VC world, a result of the huge liquidity surpluses created by the various forms of QE, consider the success of first-time PE and VC funds in raising assets without a track record.
In 2018, 32 first-time PE managers raised a total of US$8.7bn, down from US$9.7bn in 39 funds in 2017, but an increase in capital raised per fund from US$249m to US$272m. In the VC space, 2018 saw 58 first-time VC managers raising US$6bn, vs 51 managers raising $4.1bn in 2017. On a per-fund basis, assets raised per fund increased from US$80m in 2017 to US$103m in 2018.
Ask any hedge fund manager how hard it is to raise assets and the story is similar even for veterans with decade-long or more track records. And let’s not even talk about fees and lockups (or the lack of them).
The following data is from Pitchbook’s NA/EU database:


But in recent years, something has started to change: a number of factors have come together to challenge the supposed supremacy of the PE/VC model, which had until recently offered the promise of lower volatility (thanks to lockups and the exclusion of retail investors), higher returns and lower correlations.
The first is overcrowding: the preponderance of new funds entering the market in the past decade has led to a very basic problem. Too much supply of cash bidding up too few worthwhile assets, ultimately eroding the potential returns from these same assets into a new equilibrium.
Even in the most promising region for PE/VC investing - Asia - the returns are decent, but not sufficient on average to fully compensate investors for the lack of liquidity in these instruments:

As we often say, “Hedge Funds back in 2008 used to be edgy and cool, now they’re just another asset class to be allocated in and out of.” The same is about to come true for Private Equity.
The second issue is correlation. Where private investments were meant to be largely uncorrelated with the stock market, (pardon the impending double negative) they have historically not been so. Surprised? Consider this data put together in a note by JP Morgan Asset Management’s Michael Cembalest:

It turns out that adjusting for liquidity and risk, the “Public Market Equivalent (PME)” ratio for both PE and VC funds still largely tracks the S&P 500, less the anguish of seeing a mark to market that can be realised by a panic sell, saving investors from themselves and forcing them to ride through a cycle.
And where opportunities would usually have materialised in public markets for buyouts, those too have evaporated thanks to the abundance of liquidity. Public market stock buybacks have accelerated as a result, leading to a rise in public market valuations…

Source: Epsilon Theory/Bloomberg
… which itself translates to a rise in private market valuations where deals are done, whether in PE backed M&A:

Or simply the (fewer and fewer) fortunate exits that have managed to be completed so far:

Especially for Buyouts where deep value is sought and where PE has traditionally played a massive role in value (re)discovery and creation, things are getting tough. Put differently, distress is getting much harder to locate in scale.

The future for PE/VC investing is starting to look very different from its past.
Everything’s going up, so where’s the problem?
The world is full of amazing opportunities for growth and development - that’s undeniable. The problem is that everyone wants to do the big deals and they want them now, so that returns can be crystallised and reported to investors. But deals take time to grow and mature, there aren’t many more mega deals to be done. Smaller companies are higher risk and harder work - with every manager going for the easy wins, it’s no wonder small firms aren’t enjoying that many exits.
Sounds familiar?

Almost everything is at the wrong price and managers are ostensibly struggling to deploy capital that investors have committed to them.
Short of a cry of despair, and contrary to what FOMO-stricken investors want to believe, managers are actually admitting that the easy times are over in terms of driving returns:

And it’s also showing in their numbers, looking at the “Dry Powder” - capital committed but not yet spent - which has built up over the years.

Source: Preqin, Pitchbook
Most notably in the Asia Pacific region, dry powder is building up with nowhere to go. Expressed in terms of average years of investment:

Source: Preqin, Pitchbook
Splitting out for the fund vintages that carry the cash overhang, we see the difficulty in locating good investments starting to show, with an increasing proportion of 3-5 year old vintages contributing to the balance of dry powder available.
If dealmaking continues to remain this challenging for the next few years, the dry powder from the younger vintages will continue to weigh on fund performance.

Source: Pitchbook
The situation is similar in Asia, where managers - having run through the low-hanging fruit in China - are starting to find that having a pool of cash is only the beginning of the process. The results of Bain’s manager survey tell the story:

“Just stick it in the new economy, that’s where the growth is, and they all need cash, they’ll grow their way out of the losses eventually!”
Easier said than done:

But the alternative to doing nothing is worse: that capital is even more recklessly deployed in the hope of striking it big, just so that it doesn’t need to be returned unused to investors.
The result: a game of hot potato, as deals are increasingly passed around on the secondary market, from early investors to new investors who want to get in on the action.
Where secondary markets were previously used as an emergency exit for deals gone wrong, they have now become actively traded, providing liquidity to managers and in recent years serving as a means for investors to receive distributions out of their locked-up investments. The result is the vibrant and active market for private assets that we see today.
In fact, from 2013 onwards, secondary market transactions actually helped to drive net cashflows for investors to a positive.

The result was that the proverbial “J-curve”, which involved investors generally taking heavy cash outflows and paying in commitments in the early years of their PE investments, was very quickly smoothed out by early distributions, raising DPI ratios and further lulling investors into a false sense of security that the asset class has been de-risked.

So where DID all the money go?
Total private capital fundraising, including PE, VC, Real Assets, Private Debt, Infrastructure and Natural Resources, grew by just under US$5tn between 2012 and 2018. That represents about 50% of the total change in big 4 central bank balance sheet over the same period.
Add that to the buybacks and dividends that have been conducted:

Source: Yardeni Research
And on top of that add to the expansion of balance sheets outside these sectors, including households and a complete cryptocurrency boom/bust cycle thrown in for measure, and we get to the inevitable conclusion: that all of the money that was printed has been dished out, leveraged up and possibly leveraged up again.
And now a sizeable chunk of incremental new assets is locked up in typical 10+1+1+1 year structures that are illiquid with legally binding capital commitments. At least, legally binding until a bigger cash call forces a liquidation. Until then, a cash call has to be answered by selling down something else.
When the solution to the problem was to administer more of the problem itself, it probably sounded like a philosophical coup of genius - fight fire with fire, send a thief to catch a thief. That sort of thing.
But the reality was closer to kicking cans down the road.
And now we find ourselves in a situation where fundamentals don’t hold, spare cash - likely proceeds from debt - has piled up and is looking for somewhere to go (feeding banks’ tier 1 capital balances in the meantime), and leverage, previously visible on balance sheets, has gone into hiding. We can’t see it, but we know it’s there, waiting to snap anytime.
At least there isn’t a mark to market for private assets. Wait till these assets need a quoted price to be sold: ebullient markets have been going for long enough to forget what a “liquidity premium” truly means. After all, we’ve seen that secondaries are now mainstream.

Meanwhile, life goes on, in search of returns, in a market whose correlations are rising in ever-greater entanglement, taking ever-greater risks until one day something gives way and the correlations make it all for one, one for all in all the wrong ways. As more and more investors move into the “professional” investor category thanks to stagnant net worth criteria not adjusted for inflation, managers are also trying to make subscriptions to private capital fund easier - including by providing “subscription loans” to cover the capital commitments (Reuters). Estimates cited by JP Morgan Asset Management point to US$350-400bn of outstanding subscription loans, potentially suggesting the “dry powder” estimates are inflated. Putting that in context, that makes up more than 30% of the disclosed PE/VC dry powder balances.
Here’s a thought: what happens if the piles of dry powder we identified earlier were pledged on the basis of borrowings? What happens when managers call for capital but nothing comes?
These leverage numbers exclude other forms of leverage taken that are not directly attributed to an intended subscription into a private investment. How much real equity is in those reserves of dry powder as opposed to banking credit?
To hammer home the point that “equity” might actually be “debt”: recent data published by S&P Global Market Intelligence’s LCD news flags US leveraged loan issuance clocking in at -40% YTD, leading to Collateralised Loan Obligation (CLO) managers - hungry for assets - reportedly approaching Private Equity firms to push for dividend recapitalisations. If true, that’s problematic. In other words, people aren’t borrowing, business isn’t good, so lenders are asking PE managers to borrow MORE to pay more dividends out, extracting cash from their investments and replacing it with debt.

Borrowing for the sake of borrowing was never a good idea in the first place. Giving away money for the sake of borrowing, that’s on a whole new level.
Thus closes the circle between private capital and the banking system.
We can’t tell what will be the straw that breaks the camel’s back, neither can we tell when it comes.
The work we’ve done here barely scratches the surface of the tip of a massive iceberg of correlation and causality. Working out where the fault lines are and defining an investment strategy around them will take much more time. At the very least, we have an idea of where the vulnerabilities lie.
All we know is that by deploying capital prudently and with conviction, there will be pockets of opportunity - driven by our underlying themes with real-world implications - to make outsized returns, perhaps especially so on the short side.
This is because the only route back to a balanced, investable market is a cold turkey treatment via higher interest rates. Either way hurts - the only difference is whether the hurt is voluntary and controllable. We must go down, in order to go up.
The alternative (hopefully you have Ben’s note open on a separate page by now) is permanent Zombification.
* * * * *
References
Thanksgiving Eye On The Market, Michael Cembalest, JP Morgan Asset Management
Preqin Special Report: Asia-Pacific Private Equity, September 2011
Stock Market Indicators: S&P 500 Buybacks and Dividends, Yardeni Research, April 2019
This Is Water, Epsilon Theory
Private Markets Come Of Age, McKinsey Global Private Markets Review 2019
Asia-Pacific Private Equity Report 2019, Bain & Company
Private Fund Strategies Report 2018, Pitchbook
Pitchbook 2019 Private Equity Outlook
Preqin Special Report: Asian Private Equity and Venture Capital, September 2018
Preqin Private Capital Fundraising Update, Q4 2018 Data Pack